Chart: EIA Outlook Projects Natural Gas Price Below $5 Through 2050 Post author By frannyv Post date July 6, 2020 Mother and toddler spending time in the playground
Chart: Natural Gas Consumption by Sector in the United States, 2018 Post author By frannyv Post date July 6, 2020
Chart: Map of State Goals on Renewables and Carbon Reductions Post author By frannyv Post date July 1, 2020
Chart: Increase in Electric Demand for Natural Gas Driven by New Gas-fired Generation and Temporary Switching Post author By frannyv Post date June 29, 2020
Chart: U.S. Leads the World in Carbon Reductions Thanks to Natural Gas 2005-2017 Post author By daphnem Post date April 25, 2020
Chart: Future Industrial Use of Natural Gas Projected to Keep Growing 2019-2050 Post author By frannyv Post date March 6, 2020
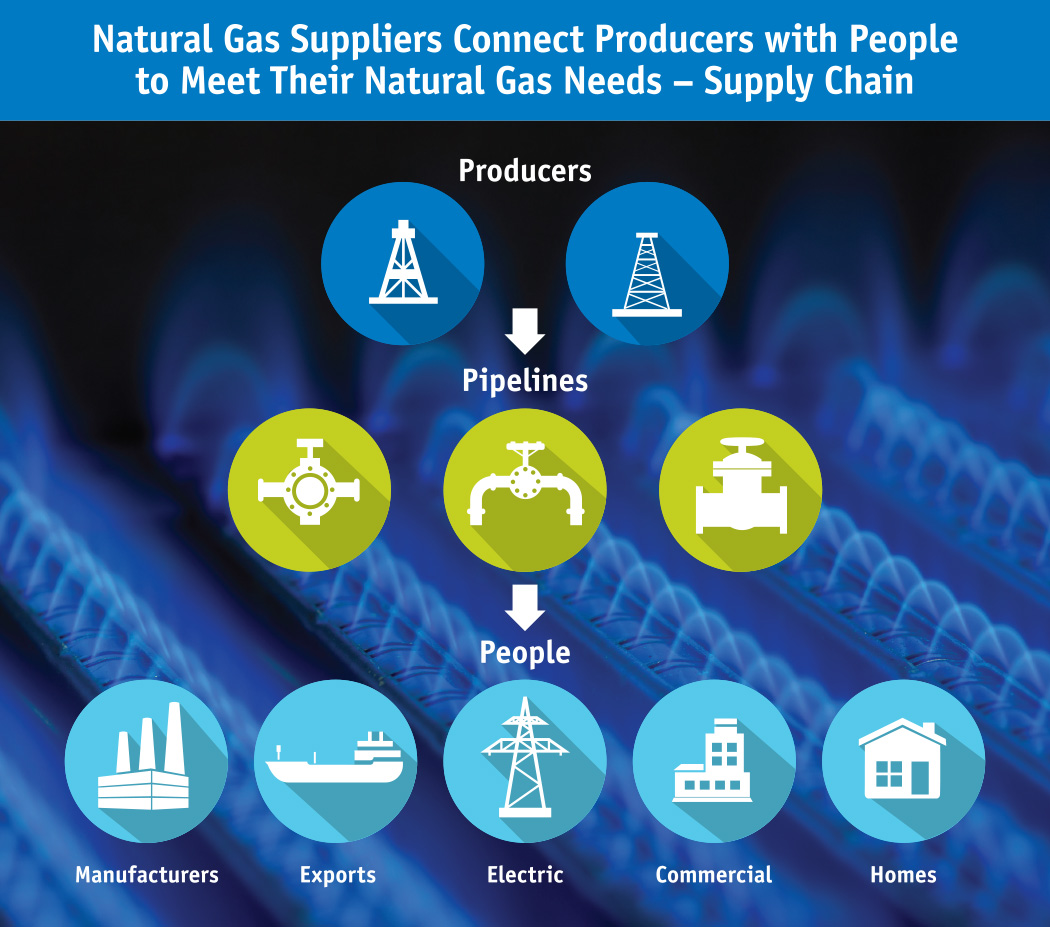
Understanding Producers, Marketers, Suppliers-NGSA’s members Post author By daphnem Post date January 23, 2020 Natural Gas Supply Chain-Producers Connected to People
Chart: A Day in the Life of a Marketing & Trading Organization Post author By daphnem Post date January 18, 2020